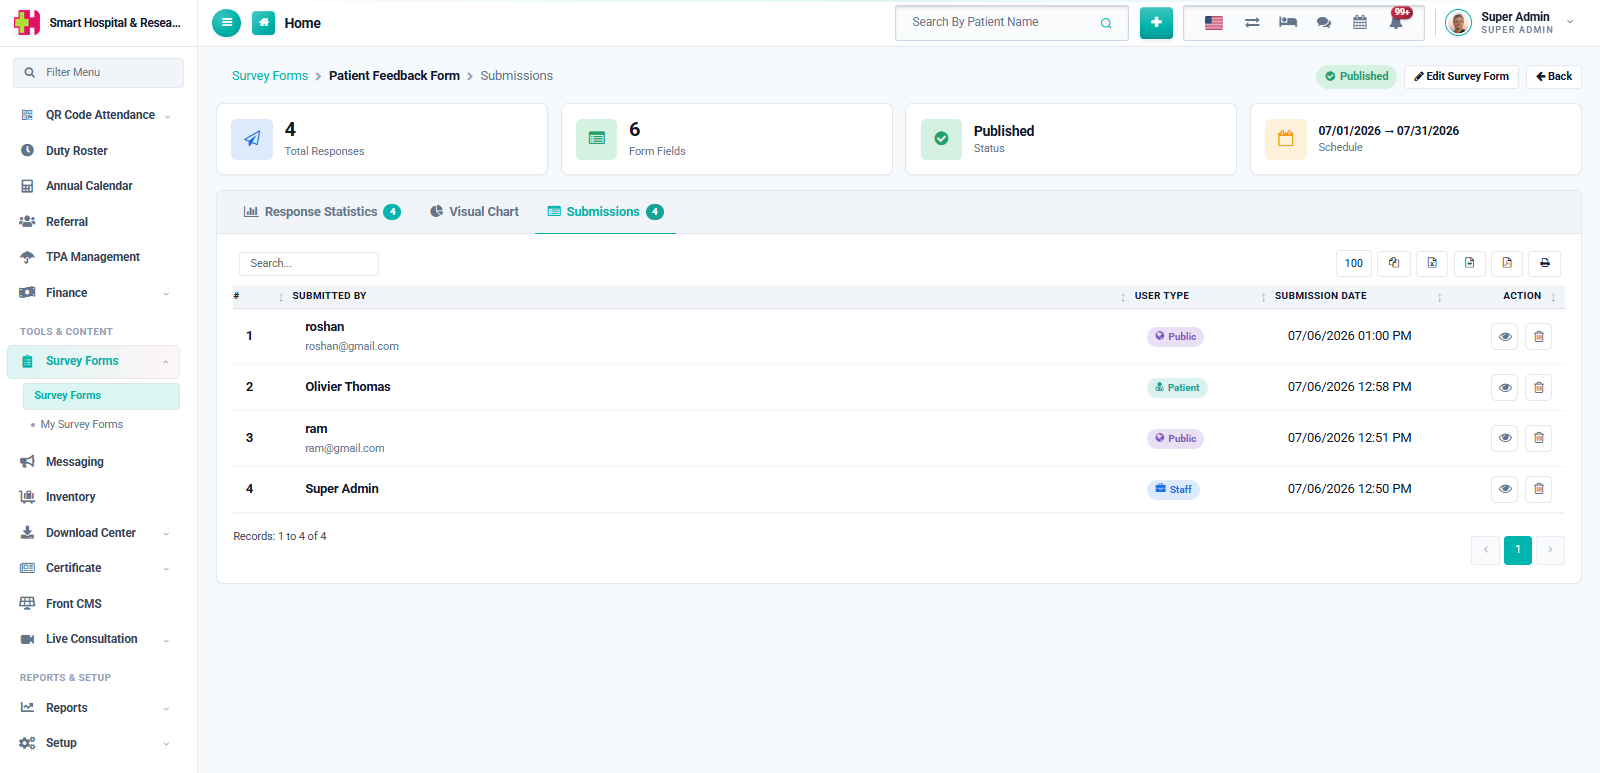
From the Survey Forms list, click the View Submissions action on any form to open its Submissions dashboard. The top of the page shows four quick summary tiles: Total Responses, Form Fields, Status and Schedule, followed by three tabs.
Response Statistics
Every Radio, Checkbox and Yes/No field gets a breakdown of votes and percentage per option, with a bar and a donut chart. Free-text fields (Text, Number, Date, Textarea) instead list every answer that was submitted.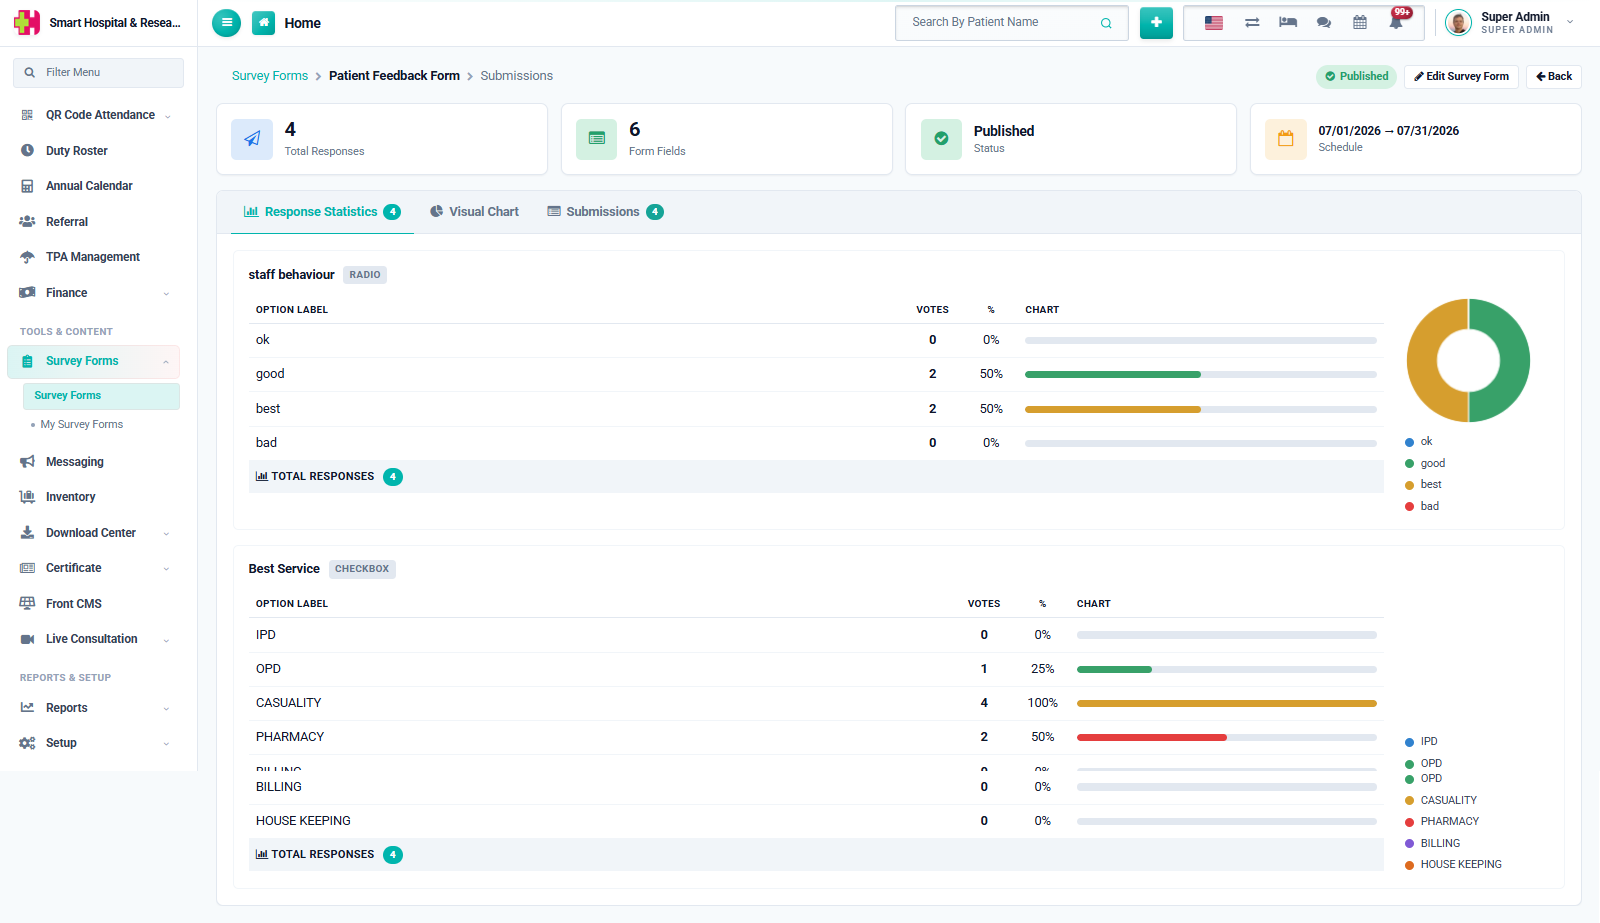
Visual Chart
A condensed, chart-only view of the same statistics — handy for a quick glance or for sharing a screenshot in a report.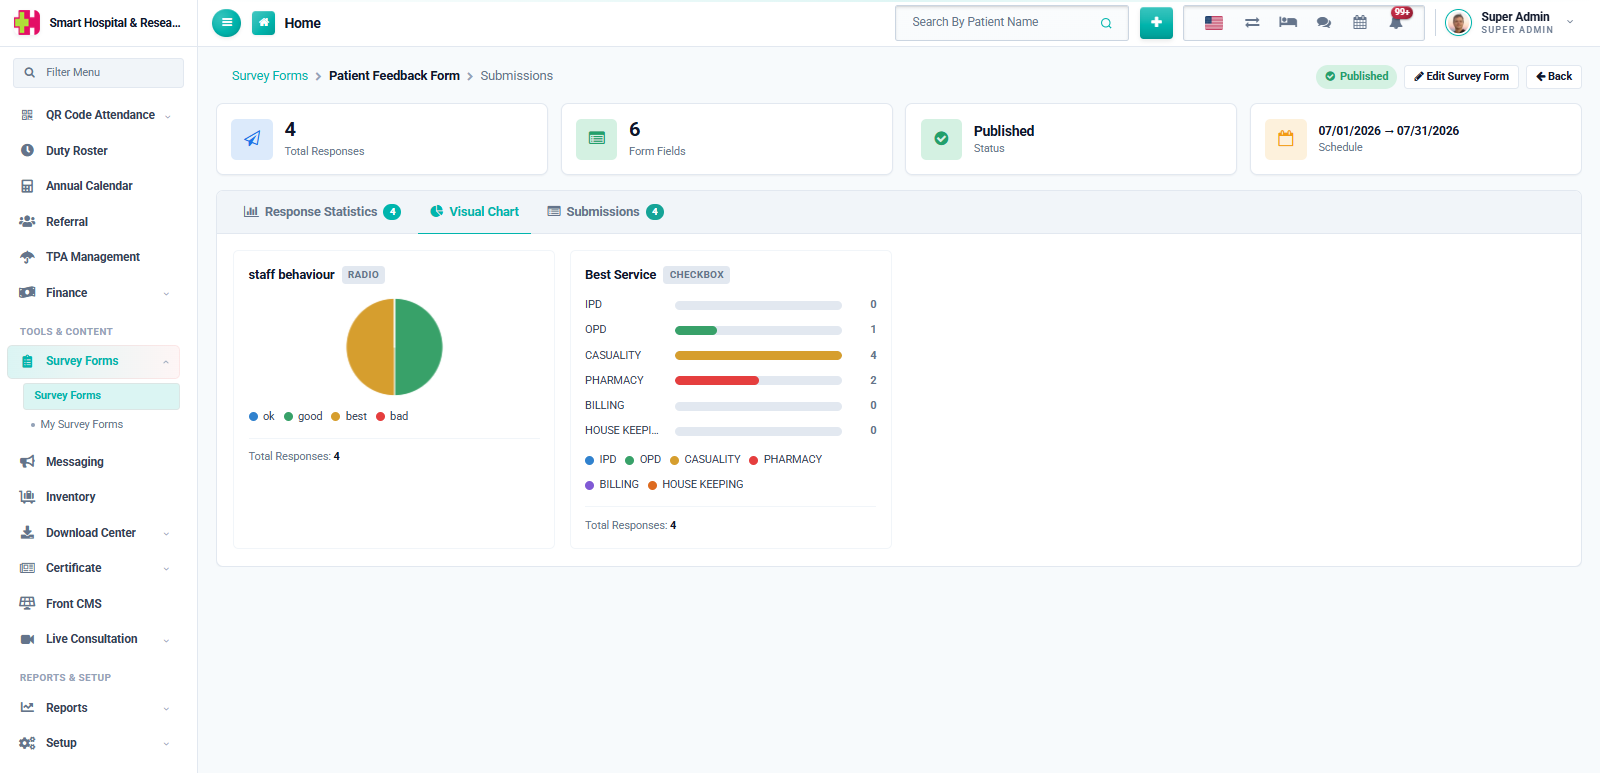
Submissions
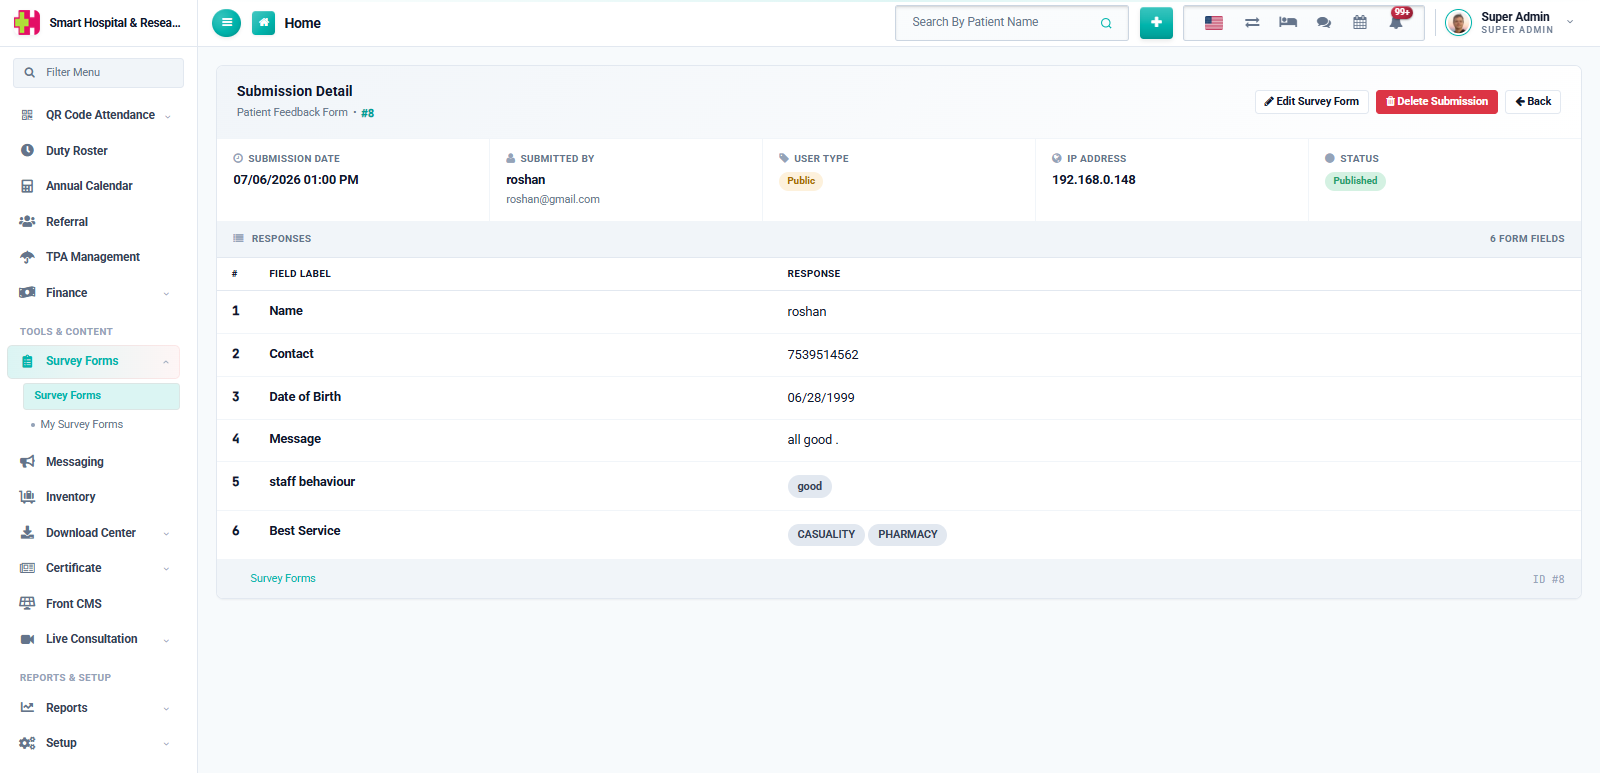
A full list of every response, with the submitter's name, an audience badge (Staff, Patient or Public), and the submission date. Click the eye icon on any row to open its full detail.